Abstract
This paper will show the analysis of the financial statements between the years 2010 and 2011 for Marks and Spencer. It will also show the analysis of the ratios for the same two years, 2010, and 2011. Furthermore, the paper will show the significant changes between the years and possible explanations for the changes based upon the annual report of 2011 for Marks and Spencer.
Introduction
Ratio analysis is one of easiest measures for identifying salient features of the company. From the working and results shown in appendix the company’s profit margins signify as to what the company’s pricing policy is and how it keeps it profits in terms of mark-up margins. In the case of Marks and Spencer, we can see that the company is a classic case of a firm initially starting out with much difficulty but quickly adapting to meet its ever-changing needs. The Gross profit margin although shows a significant decline in the two years researched. However, the massive improvement in the firm’s Net profit margin more than makes up for this shortfall. This demonstrates that the company has been able to manage its operating and administrative expenses in order to maximize its profit. It is the same story with the Return on shareholders’ equity and return on total capital. The improvements seen in these two ratios are testament to the firm increasing its Income in very quick time. The return on total assets ratio demonstrates that it is using assets in earning profits and is not weighed down by lumpy assets (Collier, 2003).
Financial Performance of the Company
Profitability
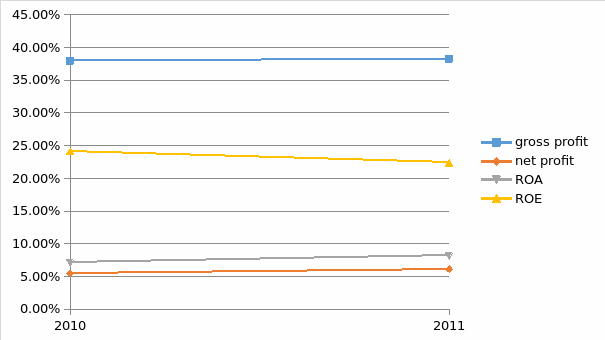
The Gross Profit Margin is calculated by dividing the gross profit by the net sales and it is 38.24% in 2011 and 37.94% in 2010. After comparing the two gross profit margins together, they fared slightly better in 2011. However, one will note that the gross profit margin appears to be constant. Its shows the company is able to pay its operating expenses and build a sustainable future. If they could find a way to increase the gross profit margin, this would inevitably increase the net profit. The fact that Marks and Spencer’s has remained successful in increasing its operating profit margin is quite commendable because the company is pursuing expansionary strategies. This suggests that in future the financial health of the company will continue to improve because the increasing profit margins will allow the management to utilize more funds. Furthermore, strong credit ratings, surplus cash flows, debt repayments, and increased levels of payout and retention ratios are few of the benefits, which Marks and Spencer will receive if this trend continues. The following is trend graph

Net profit margin shows a growth from 5.48% to 6.15% in 2010 to 2011. This figure shows the company as considerable operating and pricing effectiveness and it is successful in controlling its costs. With the figure, the company can lower fixed costs and effective gross margin. The return on total assets increased from 7.13% to 8.15% in 2010 to 2011. Technically this ratio is used to analyze how well the company investments have generated revenue. This value shows the company returns on assets is considerably low. In addition, it means that the company is not converting its investments into profits effectively. In return, on equity has decreased from 24.12% to 22.39%. It means the company is spending little amount of money on raw material hence considerable amount of funds is spared. The figure is also used to establish the profit gained per dollar unit on the stakeholder investment. In this company, it means it gains $0.2239 per dollar of stakeholder’s investment. Furthermore, the return on equity was higher from the year before, thankfully, for the company. At the same time, the return on assets, ROE, was also significantly lower in 2011 from 2010 nearly a 7.17% drop. It shows that the ROA was nearly an even break on the return in 2011.
However, this ratio shows a better performance but the amount of profits involved is minimal because of the amount of sales. This performance looks good but they only need to manage expenses such as selling, general and administration expenses. The trend of this performance is shown in the appendix.
Efficiency
Looking at their accounts receivable turnover ratio it appears to be decreasing meaning that the management was not improving the management of the collection of debts. It shows the credit policy of the company changed negatively improving. It is no doubt that company needs to improve its credit policy to avoid having bad debts. The accounts receivable turnover decreased from 10.62 in 2010 to 9.83 in 2011. This average collection period increased, it means the company spends an average of 37 days to collect on its credit in 2011 as compared to 34 days in 2010. It demonstrates the company effectiveness in extending credit to clients and collection of funds from debtors reduced. It means the company spends considerable amount of time to collect credit sales. It also means the company is generating more revenue from cash sales than credit sales. THE FOLLOWING IS THE RATIO GRAPH FOR TWO YEARS:

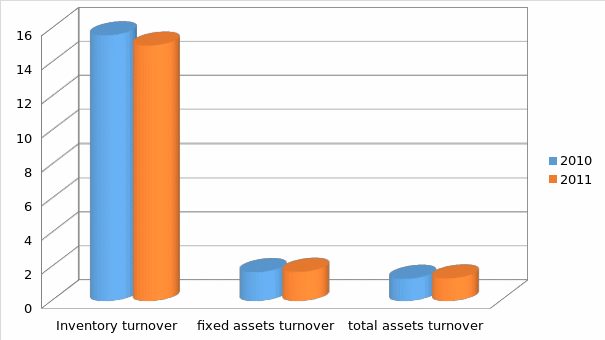
When looking at inventory turnover and days to sell inventory one will note that it increased days to sell inventory from 23 days in 2010 to 24 days in 2011. Inventory turnover ratio also decreased from times 15.55 to times 15. A high ratio means strong sales but also it is dangerous for the reason that it characterizes an investment with minimal return rate. The value symbolizes trouble in the event of reduction in prices.
When it comes to payment of creditors’ Marks and Spencer was taking more days before paying creditors in 2011 than 2010 because the ratio decreased from times 5.13 to 4.81. The operating and cash conversion cycles seems to have changed as the company was performing well.
Looking at asset utilization ratios one will note that asset turnover decreased from times 1.33 to times 1.71 in the year 2010 to the year 2011. This means the company improved the utilizing of total assets well as 2010. The level shows that the company sales are low and that the investment on equipments and plants is too much. The same case applies to fixed assets turnover also increased or improved. The company tends to have low asset turnover, thus it show the company efficiency in generating revenue or sales. This is shown by the charts in the appendix.

Now with respect to the efficiency of the firm, it can be deduced from the ratios that the firm has some work to do. This is especially evident in the fact that the average collection period has gone up. Inventory turnover also needs to see improvements. The cash conversion cycle is also a good indicator of the efficiency of the firm and it can be said that the firm needs to keep its Receivables time shorter by offering discount for early payments to its customers. These measures are important for Marks and Spencer, as it would lead it to have more opportunities to take advantage of once it has a steady stream of effectual flow of money goods to and from it
Liquidity
In assessing the financial stability of the company, various liquidity ratios have been used. Looking at the current and quick ratio one will note that the short- term liquidity is decreasing but declined by a small margin. The Quick ratio, or acid-test ratio, you add the inventories and prepayments together, then subtract them from the current assets, which is divided by the current liabilities. Like the current ratios for 2010 and 2011, the differences compared from 2010 to 2011, the ratio from 2011 is about one-third the size of 2010.The same case applies to working capital and cash ratios. These ratios determine the ability of the firm to meet short- term obligations (Brag, 2002). Although having increased its current ratio, it is still considered that a minimum that company should have is a ratio of 2:1. However, as it stands with the company turning over a huge profit, Marks and Spencer does not have to worry about making payments for short-term liabilities as much as it would have if there were no confidence in the creditors about the profitability situation at Marks and Spencer. The cash ratio is cash and marketable securities divided by current liabilities. Thus in 2010, the cash and marketable securities has a cash ratio of 0.299. The cash reserve ratio is extremely distressing at 0.298 because it is lower than the liabilities. This means the company is not able to use its near cash to extinguish its current liabilities. While current ratio shows that, the company is not in position to pay off its short-term obligation. The company has more expenses than they have cash on hand. Even if some of it can be paid for at a later time or be treated as a deferral, ideally any business should have more cash at hand than what they actually need to prevent themselves from being cornered by creditors and even employees whose wages need to be paid on a constant basis. If the sale of short-term investment was not a substantial amount then the company will continue making a negative cash flow (Weetman, 2006). From the records that are available, it appears that the company may not be in a position to sustain a cash outflow activity in excess of what it has currently. This means giving the company a loan will stress the company’s cash flows something that may lead to liquidation. This is supported by cash flow to liabilities, which shows negative results. Still, cash flow from operations is sufficient to meet interest incurred by the company.
Financial gearing
Looking at the capital structure of the two companies one will note that Marks and Spencer maintain acceptable capital structure because debt to total capital is 0.635 in 2011 and 2010 it is 0.694. It means that the company does not rely fully on funds from creditors. Debt to equity ratio shows that Marks and Spencer ratio was decreasing from 1.05 to 0.74 in 2010 to 2011. It means that the company tends to have strong operating capital and has no problem in financing hence this concept lead to high earnings. It shows the company has been aggressive in its growth with equity. Long-term solvency ratios present a very pleasing sight to the company’s shareholders. The debt to total equity ratio of the firm shows that the firm has recently taken on some debt and it far outweighs the Equity that it has raised. This is risky capital structure to have and Marks and Spencer would be advised to focus on raising funds though Equity rather than debt. The debt to total assets ratios demonstrates that Marks and Spencer has enough Assets to cover for potential insolvency to cover its debt sufficiently
These ratios indicate that the company posses a stable financial position in terms of its liabilities. Furthermore, current ratio has improved significantly from the last year whilst the total debt ratio has deteriorated slightly. However, given the fact that the cash flows and operating profit margins of the company are improving the impacts of total debt ratio are insignificant.
Investment ratios
Earnings per share – the company earning per share is double the share invested and this means the company is performing very well.
Price earnings ratio – the value shows that the market value of the shares earns 16 times more. This is sign of profitability and better market.
Limitations of Ratio Analysis
Ratios has many limitations including relying on historical data. Financial statements present the results of the past and current operations of a company. Hence, the ratios based from these statements would also be on past transactions. In investment decisions, the immediate and long-term prospects of the company are as important as their historical performance, sometimes even more important (Carey and Essayyad, 2001).
Financial ratios by themselves have limitations. Another fundamental limitation is the way financial statements themselves are prepared. Accounting principles allow companies to choose what accounting treatment to use in recording their transactions. An example is companies can also use different depreciation method – straight line, sum-of-the-years’-digits, double declining, etc. – while still not violating generally accepted accounting principles(Carey and Essayyad, 2001).
Moreover, managements of companies also engage in what is commonly called as window dressing. Window dressing is the management of companies prepares financial statements with the intention of presenting the financial operations and transactions of the companies in a more attractive tone rather than merely reporting what is (Brag, 2002).
Management, having control of the operations of a company, has the discretion on its financial transactions. Management, in order to present attractive financial results, can postpone necessary expenditures. For example, to increase net income, managers might postpone advertising expenses, which, in the end, is detrimental to the company (Weetman, 2006).
Ratio analysis is used as a tool for effective management of their limited resources. The ratios indicate a general trend of financial performance of an organization using the data from its financial reports. This serves as a means of comparison between years and with competitors to gauge its control over its costs. This may shoe a true report of the future.
Accounting principles
One of the principles applied is that accounts are prepared on historical cost principles. The cost of an item is recorded or can be recorded in numerous ways. The Historical cost is the cost on which we as individuals, usually record our assets. The concept of historical cost implies that the asset will be recorded at the cost on which is purchased and on the value that it currently holds in the market or its recoverable value or any other value. Inventory is recorded on cost or realizable value depending on the nature and duration has been in store. Depreciation is been charged based on reducing balance method.
They also use accrual basis of accounting in preparing their financial statement. It entails that the transactions are recorded as they occur and the payment and receipt of cash is a separate transitions that is recorded on its respective occurrence.
The company also used double entry accounting that entails that each debit has a corresponding credit and each credit has a corresponding debit. The method of double entry accounting ensures that the transactions are not recorded without an appropriate basis and just cause. In the absence of the double entry accounting system, transactions can be recorded without a just cause, which allows numerous discrepancies to go on unreported. The Double Entry System prevents fraud by disallowing any transactions without a just cause shows up in the corresponding debt or credit.
Conclusion
The analysis of Marks and Spencer reveals that the company is in sound managerial, strategic, and financial health. In other words, the company possesses a clear vision, tested strategic approach, and sound financial health, which will help the company to sustain and improve its growth. In terms of financial management, the company has taken several steps to ensure that financial strength will continue to grow. Moreover, the increasing profit margins will allow Marks and Spencer’s Corporation to take advantage of new opportunities and/or reduce the level of its liabilities.
Reference List
Brag, S. 2002. Business Ratios and Formulas: Comprehensive Guide. New Jersey: John Wiley & Sons Inc.
Collier, P. 2003. Accounting for Managers: Interpreting Accounting Information for Decision-Making. New York: John Wiley and Sons.
Carey, O. & Essayyad, M., 2001. The essentials of financial management. New York: Research & Education Association.
Weetman, P. 2006. Financial Accounting: an Introduction. New York: Financial Times Prentice Hall.

