Introduction
Over the years, companies in the oil and gas industry have enjoyed large revenues. In the world, six supermajor oil companies dominate the petroleum industry. This paper carries out a three-year time analysis of two of these “Big Oil” companies, British Petroleum (hereafter referred to as BP) and the Royal Dutch Shell plc. (hereafter referred as Shell). These two multinational companies are both constituents of the FTSE 100.
Based in London, BP is a British Multinational company that operates in over 70 countries. As of 2015, the company was ranked as the sixth largest oil and gas company and had the 14th largest revenue in the world. The company was founded in 1908 as the Anglo-Persian Oil Company, a subsidiary of Burmah Oil Company. The British government owned the majority shares in the company until the privatisation of BP that was carried out in stages between 1979 and 1987 (British Petroleum, 2015). In 1998, the company merged with Amoco and became BP Amoco plc. In 2000, the company acquired Burmah Castrol and ARCO finally becoming BP plc. The company’s main strength is its long history in the oil and gas industry that has allowed it to acquire a solid foothold in the industry. The company also utilises a vertical integration strategy that has enabled it to operate in all areas of the industry including distribution, refining, production, exploration, power generation, petrochemicals and marketing. The company has a primary listing in the London Stock Exchange and secondary listings on the New York Stock Exchange and the Frankfurt Stock Exchange (BP, 2015). The company has experienced several accidents that have had severe financial, health and environmental consequences. The biggest infraction was the Deepwater Horizon oil spill in 2010 that is regarded as the biggest marine oil spill ever recorded. The company was forced to pay over $4.5 billion in penalties and fines, leading to the sale of several resources to cover the cost.
Royal Dutch Shell is the second largest oil company in the world and as of 2016, the 7th largest company based on revenues. The company has its headquarters in The Hague (Netherlands) and its registered office in London. Shell operates in over 90 countries and has over 44,000 service stations all across the world. The company was created in 1907 as a result of a merger between the UK based ‘Shell’ Transport and Trading Company (40% ownership) and the Royal Dutch Petroleum Company based in the Netherlands (60% ownership) (Shell 2015). Each of the constituent companies retained their legal existence until 2004 when Shell announced that it was adopting a single capital structure. In the same year, the newly formed company registered the London Stock Exchange as its primary listing and the New York Stock Exchange and Euronext Amsterdam as its secondary listings. The company uses a vertical integration strategy that enables commercial and technical expertise in all areas of the oil industry including exploration, mining, marketing and distribution, and trading. In 2015, Shell had the largest market capitalisation of all companies listed on the London Stock Exchange.
Ratio and Trend Analysis
Liquidity Ratios
The current ratio is the most commonly used when determining the liquidity of an organisation. The ratio portrays the amount of current assets available to pay a dollar-worth of current liabilities.
Current Ratio = Current Assets/Current Liabilities
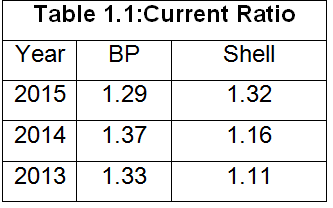
According to the table, the current ratio of BP increased from 2013 to 2014 but decreased in 2015 compared to that of Shell, which has been continually increasing during the same period. The current ratio, however, is not an accurate measure of liquidity as we cannot consider inventories, which is a part of current assets, a means to pay debts (Peterson &Fabozzi, 2012).
The quick ratio is therefore a more accurate assessment tool for liquidity.
Current Ratio = Current Assets – Inventories/Current Liabilities
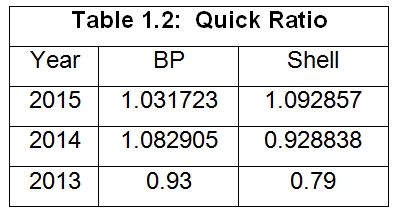
The table shows that Shell was not truly liquid until 2015 but it has been steadily increasing its assets during the period under review. BP on the other hand has been liquid for the past two years but has suffered a large decrease in liquidity during the same period. This can be attributed to the sale of several assets in order to cover fines arising from Deepwater Horizon oil spill (BP, 2015). In July 2015, BP was required to pay additional penalties worth $19 billion as the judge ruled that the oil spill was a result of gross negligence. Overall, both companies have low liquidity ratios. The liquidity ratios show that investors are safer choosing Shell over BP as it is more stable and shows constant progress over the three-year period.
Asset Management Ratios
The total asset turnover is a measure of how effectively an organisation is utilising its assets (Peterson &Fabozzi, 2012).
Total Assets Turnover = Sales/Total Assets
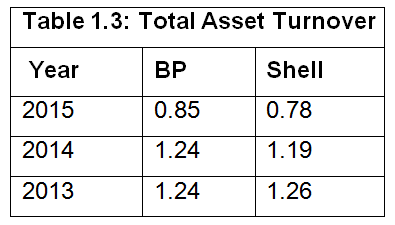
From the data shown, it can be seen that both companies have very low values, especially in 2015. According to the table, in 2015 each dollar of assets in BP generated $0.85 in sales while Shell generated $0.78. This means that while BP is a little better than Shell, the level of sales for both companies do not reflect the assets invested.
The fixed asset turnover is a very important asset valuation tool for capital-intensive companies. This ratio describes how effectively a company uses its fixed assets to generate revenue. This ratio calculates the sales produced from a certain level of investments in fixed assets.
Assets Turnover = Sales/Assets
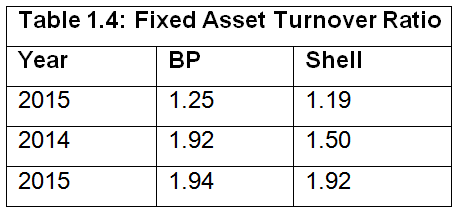
According to the table, both companies have experienced a gradual decrease in fixed asset turnover. The data confirms that BP is better at utilising its assets to generate revenue compared to Shell.
The accounts receivable turnover shows the number of times per year that a company collects its debts owed. It shows the number of days that it takes creditors to pay back the company.
Accounts Receivable Turnover = Saleson Credit/Accounts receivable
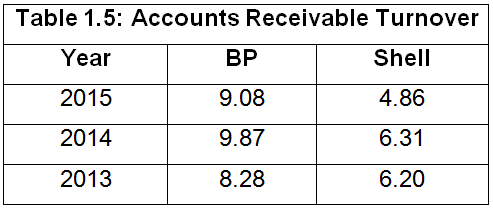
The table shows that the accounts receivable turnover for both companies increased between 2013 and 2014 but decreased in 2015. BP, however, has a larger turnover ratio compared to Shell. Analysts usually express accounts receivable turnover in terms of the number of days an organisation takes to collect cash after sales. This ratio is calculated by dividing 365 days by the accounts receivable turnover. Table 1.6 shows the collection period of both BP and Shell for the three year period between 2013 and 2015.
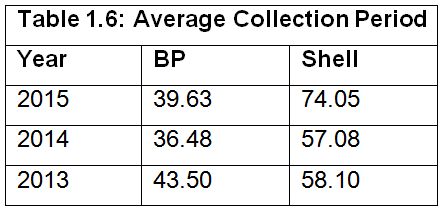
The increasing accounts receivable ratio and decreased collection period in BP is as a result of a decrease in the fraction of sales made on credit versus cash. Due to financial difficulties at BP resulting from the Deepwater Horizon oil spill, it is imperative to decrease the amount of time that money remains uncollected. As the collection period increases, the amount of working capital needed also increases (Delen et al., 2013). From the data provided, therefore, it can be concluded that at any particular time in the three years under review, Shell has had more working capital than BP.
Days of Inventories (DI) indicate how efficiently a company manages its inventories. The DI ratio allows the monitoring of the number of inventories that a company has. The ratio gives the number of days that a company ties up funds in inventories.
Days of Inventories = Inventories/(Cost of Sold/365)
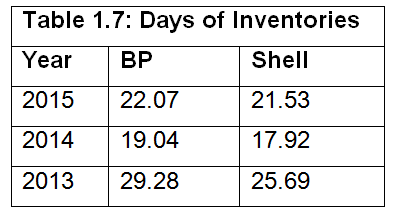
According to Table 1.7, in 2015 it took 22 days for BP to sell its inventories while Shell took 21 days. Considering that Shell produces 3.1 million barrels of oil equivalent per day while BP produces 3.3 million barrels, Shell enjoyed a larger profit and thus had better performance overall.
Profitability Ratios
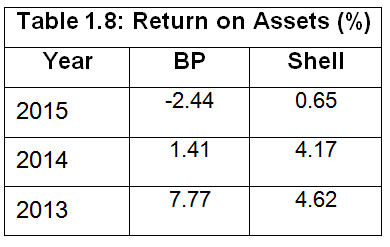
Return on Assets is the most commonly used profitability ratio. It determines the amount of profit generated by the assets of the company.
Return on Assets = Net Profit/Total Assets
The Return on Common Equity (ROCE) measures the amount of money generated by shareholders’ investment (Nissim& Penman, 2001).
Return on Common Equity = Net Profit/Total Equity
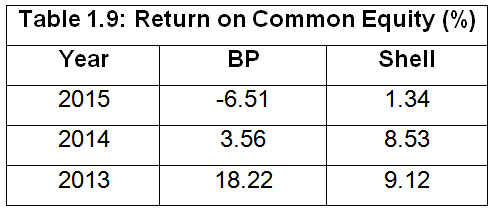
According to the table, the Return on Common Equity has been steadily decreasing since 2013. In 2013, the ROCE value of BP was double that of Shell. The company however experienced a sharp decline in ROCE value decreasing from 18.2% to 3.6 % in 2014, to -6.5% in 2015. Returns for Shell remained relatively constant between 2013 and 2014 but also experienced a sharp drop in 2015. While BP’s problems are caused by the Deepwater disaster, the decrease in Shell’s ROCE can be attributed to cessation of activities in Alaska. Overall, the ROCE values show that Shell had a better performance than BP and is the more stable of the two companies. Shell has been able to provide some income to investors through the years while BP was unable to maintain a positive return. According to 2015 figures, every dollar of the shareholder’s investment experienced a 6.5% loss for BP and a 1.3% profit for Shell.
The gross profit margin determines how efficiently a company utilises labour and raw materials during the production process.
Gross Profit Margin = (Gross Profit/Sales)*100
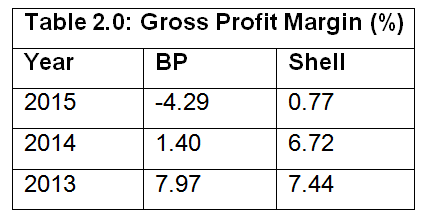
From Table 2.0, it is evident that the gross profit margins for both companies are very low and have been decreasing over the past three year period. BP experienced a loss in 2015, and therefore shows a negative gross profit margin. Since prices of oil products are usually very volatile, both BP and Shell were not able to adjust their prices to cover the various costs of production, hence the low margins shown in the table. The extremely low gross profit margin experienced by BP in 2015 means that the company was unable to pay for its operating expenses. BP is therefore at a very fragile position and is not a safe option for investors. While Shell has low GP margins, it can meet all its expense obligations and as a result, plan for a better future.
The net profit margin compares the net profit to the amount of sales in a company.
Net Profit Margin = (Net Profit/Sales)*100
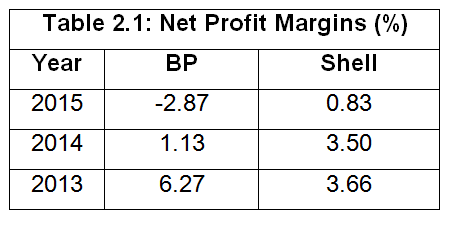
From table 2.1, the net profit margin for both companies progressively decreases during the three years period under review. Between 2014 and 2015, both companies show a sharp decrease in net profit values. As explained above, BP had to pay steep penalties in 2015 while Shell ceased several profitable ventures in the same year.
The operating profit margin shows the ability of a company to meet its debt obligations as well as its ability to create value for shareholders.
Operating Profit Margin = (Operating Profit/Sales)*100
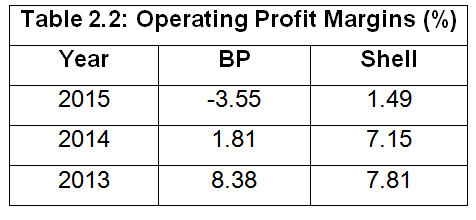
The operating profit margins for both companies are quite low with BP showing a loss in 2015 while Shell maintained a positive value, albeit a very small one. Companies also need a good profit margin to pay for their fixed costs; therefore, a low margin means that a company has a larger financial risk. From Table 2.2, BP is shown to be more financially risky than Shell.
Financial Leverage Ratios
These ratios measure the amount of financial risk that a company has taken on. A company can finance its assets through debt or equity. Equity financing does not obligate the company in any way and dividends can be paid depending of the financial position of the company. Debt financing carries a lot of financial risk as the company is legally obligated to pay both the principal and the interest within the timeframe agreed upon (Weil et al, 2013).
The debt ratio and the debt-to-equity ratio are the most popular calculations to determine the financial leverage of companies. The debt ratio compares the total debt to the assets of the company.
Debt Ratio = Total Liabilities/Total Assets
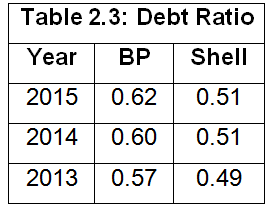
According to Table 2.3, the debt ratio of BP is higher than that of Shell. All companies should try and maintain a debt ratio of 0.5 or less (Peterson &Fabozzi, 2012). This means that debt can only be used to finance a half or less of the company’s assets. Over the three-year period under review, BP had an average debt ratio of 0.6% which is less than ideal. Shell, on the other hand, was able to maintain values of about 0.5 during the same period, which is acceptable. Since the oil industry is capital intensive, values of 0.7 are still acceptable to investors hence both companies are within the range of what is tolerable.
The debt-to-equity ratio compares the debt accumulated by a company to its shareholders’ equity. This ratio shows the relative amount of debt and equity used as a source of capital to finance assets.
Debt-to-Equity Ratio = Total Liabilities/Total Shareholders Equity
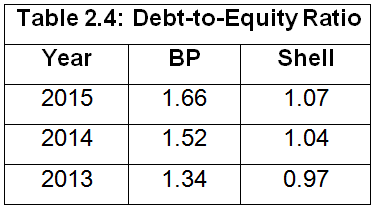
From the table, BP is shown to have a higher debt-to-equity ratio than Shell. The ratios of both companies also increase over the three-year period meaning that both companies are borrowing more money to finance their operations. In ideal conditions, the debt-to-equity ratio should not exceed one. BP is therefore more risky as its values are significantly higher than the ideal value while Shell is able to maintain a value closer to one.
The interest coverage ratio is used to account for some limitations apparent in the debt ratio and the debt-to-equity ratio. The debt ratios consider the amount of borrowing but do not consider the ability of a company to meet its debt obligations (Weil et al, 2013). At the same time, not all companies pay the same interest on debts. To rectify these oversights, the interest coverage ratio is used as it determines the ability of a company to pay off its debts.
Interest Coverage Ratio = Operating Income/Interest Expense
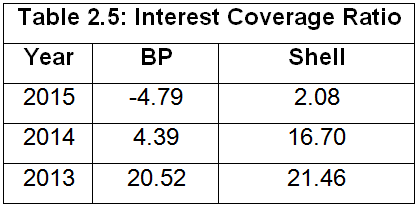
The table shows that for the three years under review, the interest coverage ratios for BP are much lower than those of Shell, especially in 2014 and 2015. A high interest coverage ratio means that a company has enough capital to meet its interest expenses. Values lower than 3 signify that a company may have problems paying its interest expenses. In 2013 and 2014, both BP and Shell had adequate ratios with shell outperforming BP. In 2015, BP had a negative value meaning that it was unable to pay its interest expenses. This also means that the credit rating of BP is at risk of being downgraded due to its inability to meet its obligations.
Shareholders’ Ratios
These ratios deal primarily with the interests of shareholders. The ratios calculate the amount of income that an investor can expect for each share of stock held. Earnings per share describe the portion of profit allocated per share of common stock.
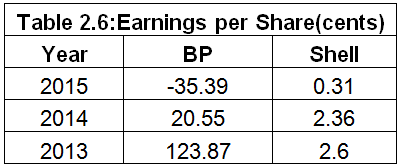
In 2013 and 2014, BP had very large earnings per share but suffered a loss in 2015. Shell on the other hand maintained its earnings per share at about two cents over 2013 and 2014 although it experienced a decrease in 2015. On the basis of earnings per share, BP has consistently been more profitable than shell except in 2015 when the company had to pay billions of Dollars as penalties for the 2010 oil-spill.
The book value per share describes the amount of money shareholders could get per share if the company liquidates.
Table 2.7 shows the Book Value per Share for BP and Shell for the period 2013-15.
Table 2.7, shows that Shell has higher book values per share than BP. In 2014, both companies experienced a rise in book values per share, which then reduced in 2015. Considering the amounts of book value per share, Shell is clearly a much more attractive investment opportunity when compared to BP.
In order to gauge the suitability of an investment, it is important to consider the dividends per share. This is the amount of money paid out as dividends to every share held by investors.
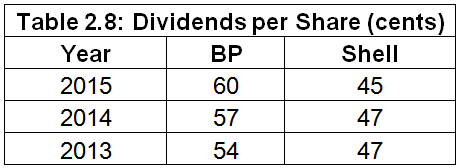
The table shows that BP has been increasing the amount of dividends paid to its shareholders over the three-year period. Shell on the other hand maintained its dividend pay-outs in 2013 and 2014 but decreased the amount for 2015. Considering the decreasing profitability of BP, it can be concluded that the company needs to maintain investors’ confidence and thus has to pay out increasing amounts of dividends to secure funding for the future.
Explanation for Excluded Ratios
This analysis has included all the ratios that are required when dealing with companies in the oil industry. A few ratios have been excluded, such as dividend cover and dividend yield, as they only provide information that is already present because of other calculations.
Management Accounting Concept in Relation to the Oil Industry
Management accounting involves the use of accounting information to make important decisions in an organisation. Management accounting mainly deals with performance management, strategic management and risk management. The oil industry differs from other industries through having high production outputs as well as operating in volatile market that is highly affected by the existing political and economic status. Management accounting therefore is very important in ensuring success.
According to Adler (2013), management accountants utilise both financial and other decision-making information to develop strategies that may better the operations of a company. BP has developed a strategy that concentrates on value over volume. The company invests only in those activities in which its distinctive strengths are evident.
As the oil and gas industry is highly volatile, it is important for BP to institute cost accounting measures. BP has developed mechanisms that allow the company to collect, allocate and analyse strategic options and cost control options. The price of oil and gas is affected by demand and supply, economic conditions, political condition in oil producing countries, natural disasters, weather and operational issues. BP has ensured that its cost management practices are able mitigate some risks involved.
Activity-based management is also an important concept in modern accounting practice. Most companies in the oil industry usually deal in multiple areas of operation. BP deals in all areas of the oil industry from exploration, mining to distribution. In order to ensure that no areas of operation suffer, the company has instituted vertical integration. This allows for an organisational structure that is less reliant on centralised control but can operate independently without input from the head office.
An important aspect of management accounting is advanced financial analysis. The use of financial ratios can help the management of a company to gauge the company’s strength, its performance, competitive edge, investor’s confidence and profitability (Hirsch, 2010). The oil industry is highly competitive as many businesses try to dominate a volatile market. Advanced financial analysis can therefore enable managers to make strategic decisions that may ultimately improve the company’s performance as well as competitive edge.
Finally, management information systems are an integral aspect of modern industries. They manage all the information systems used by the company in order to generate data that is more effective and efficient in making strategic business decisions. BP has invested heavily in information technology and has outsourced several important business processes to IT contractors to ensure that they have the best information to make business decisions.
Conclusion
While BP has a lower ranking than Shell in terms of size and revenue generated, most of its performance problems were because of various accidents that have cost the company a lot of money in terms of fines. The Deepwater incident of 2010 has been affecting the performance of BP for the past 5 years. The company has had to sell some holdings in order to generate money to cover pay-outs and penalties.
Due to the problems facing BP, it has increased the amount of debt financing used. Shell has been able to maintain the amount of debt financing at 50% but BP increased this portion to over 60%. The interest coverage ratio of BP is very low, particularly in 2015 when it was negative. The company faces a downgrade on its credit rating that will lead to difficulties in financing its operation as well as a decrease in investor confidence.
The volatility of the oil industry as well as political instability in most oil producing countries has also had a significant impact on both companies. BP has been increasing its dividend payments despite its deteriorating performance. This paper concludes that BP is facing financial troubles and is using its dividend payments to maintain investors’ confidence. Shell is in a better financial position than BP and is a much more attractive investment option.
References
Adler, R., 2013. Management Accounting. 5thed. New York: Routledge British Petroleum, 2015.Annual Report and Form 20-F 2015, London: BP.
Delen, D. Kuzey, C. &Uyar, A., 2013. Measuring firm performance using financial ratios: A decision tree approach. Expert Systems with Applications: An International Journal, 40(10), pp.3970-83, Web.
Hirsch, M., 2010. Advanced Management Accounting. New Jersey: Wiley and Sons Nissim, D. & Penman, S., 2001. Ratio analysis and equity valuation: From research to practice. Review of Accounting Studies 6, pp.109-54, Web.
Peterson, P. &Fabozzi, F., 2012.Analysis of Financial Statements. New York, NY: Wiley and Sons.
Shell, 2015.Shell Annual Report and Form 20-F 2015, London: Shell.
Weil, R. Schipper, K & Francis, J., 2013. Financial Accounting: An Introduction to Concepts, Methods and Uses. New Jersey, NJ: Cengage Learning.
