Quality is a vital feature in any undertaking. Whether it is a process or product quality remains one of the most critical characteristic that must be carefully analyzed and controlled to add value to the process or product. Tools and techniques are available to ensure that quality management is professionally performed (Duncan, 1996).
Several tools are available to manage quality that include Pareto chart, control, run charts, and flow charts, Ishikawa diagrams (fishbone), scatter plots, and check sheets, and lists.
Pareto charts: Typically bar charts arranged in descending pattern from the highest bar on the left to the lowest on the right. The Pareto analysis consists of a number of steps like gathering the raw data, defining the raw data by sorting and ordering, assigning suitable labels to the axes of the chart, deriving the bar chart for every category, calculate the cumulative totals for every category, and optionally drawing a cumulative line as an addition to the plotted bar chart
Scatter plots: This is typically a line graph with no line. This diagram has the Y axis assigned to represent the variable whose behaviour can be predicted.
Control charts: This tool is used as a means of statistical process control. These charts are used to identify if the variables under consideration have consistent measurable characteristics.
Run charts: This is a tool used to evaluate processes based on time or order. This tool involves gathering, organizing, charting, and interpreting data.
Cause and effect/ Fishbone/Ishikawa diagram: Also called the fishbone or Ishikawa diagram and is used as the initial step in problem solving process.
Check sheets/List: The check sheet is an interpretive and adaptable data recording form suitable for both qualitative and quantitative data collection. The check list defines all the operational conditions and steps to be taken during a certain process.
Flowcharts
This tool shows direction flow. This can be used to model processes, opportunities, and decision points within a process. This is an important tool to help our understanding of the process flows. The flow chart as one of the seven tools of quality management is a pictorial map of a certain process. This tool can be used to visually to represent a process as it is carried out (Schwalbe, 2010). The flowchart ensures that those inefficiencies and any potential improvements within a process are identified. This tool captures and represents the steps of the process analyzed. Such steps may as well include mental decisions. The flowchart components represent the processes and decisions using predefined symbols.
Based on the Green computing research project that proceeds according to the five processes of the Project Management Body of Knowledge (PMBOK), we can pictorially represent these steps using the flowchart.
The main processes of the project management process according to PMBOK include the following:
- Initiation
- Planning
- Development/Implementation/Execution
- Project control
- Project close out
These steps have to follow a defined sequence beginning with the initiation stage. After each of these steps, there is a decision to move to the next step after certain accomplishment(s) that we can call deliverables. Therefore, the decision to progress on to the next step is only valid after answering the question “has this step’s deliverable(s) been achieved?”
A positive means the project can progress to the next step; otherwise, there may be need for iteration so that the process is repeated until a positive outcome is achieved.
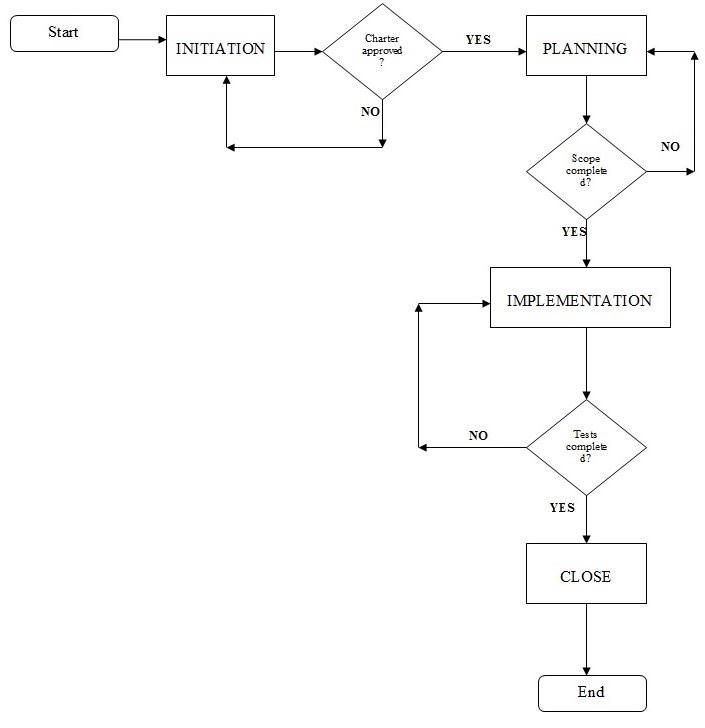
The flowchart can therefore be used to model the five main processes in which the initiation stage will only close and progress to the planning after the project charter has been approved by the project sponsors. In this case the charter can be used as a decision point in the flowchart where the question for decision-making would be “has the project charter been approved?”
If the answer to this question is yes the flow can proceed to the planning stage.
At this point there are also a number of questions to ask. Each question will result in a decision. For example a typical question would be “has the scope statement been completed? Has the project plan been completed? Has the project manager assembled the project team? If the answers to these questions are positive, the flow can proceed to the implementation stage.
At this point a number of questions to determine the ultimate decision can be asked. Such questions would be like “Has the project requirements been procured?” “Has the model been tested?” “Has the user accepted the test results?”
If the answer to these questions is positive then the project can proceed on to close.
The diagram below is a flowchart representing the five main processes according to PMBOK with intermediate decision points that must be determined to ensure the flow
The flow chart is a suitable quality verification tool to be used by the project managers during a presentation to the project stakeholders. The main decision points within the project life cycle can be clearly illustrated and their outcomes evaluated.
References
Duncan, W.R. (1996). A guide to the project management body of knowledge. Sylva, North Carolina: Project Management Institute.
Schwalbe, K. (2010). Information technology project management. Boston: Course Technology-Cengage.
