Abstract
Nowadays, the financial analyses of big organizations make a rather significant contribution to the development and exploration of current financial leaders in the market. The organization of Apple, its structure, financial intricacies, and structural decision-making systems inquire special research. Hence, this paper is dedicated to doing a comprehensive financial analysis of a publicly traded corporation and providing substantial information to make recommendations regarding investing in this corporation. Our hypothesis is that, despite its slow decline in the last couple of years, Apple Inc is still a financial leader in the market of computer technology.
History of the Apple Company
Apple Inc was established in Cupertino, California, on April 1, 1976, and incorporated on January 3, 1977. Its core business is electronic technology products, with a global PC market share of 7.96%. The Apple II helped fuel the personal computer revolution in the 1970s, followed by the Macintosh in the 1980s (Al Kibaida, 2020). Best known for its Apple II, Macintosh computers, iPod digital music players, iTunes music store, and iPhone, the company’s software applications include Mac OS, iLife, iWork, and internet applications such as Safari and QuickTime, among others, is known for its innovation among high-tech companies. On January 9, 2007, apple computer Inc. changed its name to Apple Inc. Steve Jobs was a co-founder and was still the CEO until August 2011, and now the CEO of Apple is Tim Cook. Apple Inc. went public on December 12, 1980, and reached a market value of $623.5 billion in 2012 (Wild, 2019). On August 21, 2012, Apple became the world’s largest listed company by market capitalization. The gradual tapering of the fed’s bond purchases quickly affected not only commodity and stock markets but also bond markets. As of June 2014, Apple Inc. has been the world’s largest company by market value for three consecutive years. Apple ranked 15th on the 2014 Fortune 500 List. On September 30, 2013, Apple surpassed Coca-Cola as the world’s most valuable brand in Omnicom’s “best global brands” report. In 2014, the Apple brand surpassed Google to become the most valuable brand in the world. Apple specializes in developing, manufacturing, and selling personal computers, servers, peripherals, computer software, online services, and personal digital assistive devices. It was the third-largest personal computer supplier in the world in 1995, ranking 11th in the “top 100 information technology companies in the world” and 25th 26 in the “top 50 software manufacturers in the world”. 1994-1995 years in the global multimedia market share ranked first.
Apple’s Organizational Structure
The compartmentalization initiatives of Apple Inc were guided by product orientation rather than organizational functioning needs. The corporation’s diverse core activities are initial human resources, information systems, management of materials, and infrastructure. The company constantly alters the organizational structure of its working facilities in order to maximize the outcome and the quality of computers (Al Kibaida, 2020). However, there are various complex positions that exist for quick information and communication transmission and usage. The corporate is proven to prefer departmental expertise for every particular problem. The company facilitates market leadership and innovation in other geographical locations through the creation of mid-level management positions.
Apple Inc. It is an American corporation that manufactures personal and tablet computers, headphones, phones, software and is also one of the main and popular in the field of personal computers and modern multitasking operating systems with a graphical interface. Exactly this is the definition is given by the company itself.
The share price is influenced by a variety of factors such as demand, supply, market sentiment, company bottom line, production and launch of new products, and sales volumes. Just as big the role in determining the value of shares is assigned to an already established brand, thanks to which the organization has become popular among the circle of buyers.
The company, by developing technologies and introducing its new products to the market, certainly attracts a large number of investors. But, unfortunately, with an unsuccessful release of products or, for example, corporate news, the company may stagger (Wild, 2019). Due to the fact that the market capitalization of the company has reached a historical maximum, technical and fundamental analysis of the dynamics of its shares is relevant.
Industry
The company reports segment information based on the “management” approach. The management approach designates the internal reporting used by management for making decisions and assessing performance as the source of the company’s reportable segments. Apple Inc. manages its business primarily on a geographic basis (Chen, 2016). The company’s reportable segments consist of the Americas, Europe, Greater China, Japan, and the rest of Asia-Pacific. Americas includes both North and South America. Europe includes European countries, as well as India, the Middle East, and Africa. Greater China includes China, Hong Kong, and Taiwan. The rest of Asia-Pacific includes Australia and those Asian countries not included in the company’s other reportable segments.
Primary Competitors and Products
Today (as of February 21, 2020), market Apple’s capitalization is $ 1.37 trillion at this indicator, P / E – 24.72 (in the industry 15.31). The company’s dividend is $ 3.08 per share (or 0.96%). As for the primary competitors, global smartphone shipments reached 330.4 million units in the first quarter of 2019, down 4.34% from 345.4 million units in the same period last year. At present, the top five mobile phone brands in the global mobile phone shipment list are Samsung, Huawei, Apple, Xiaomi, and OPPO. These five mobile phone brands account for 68.6% of the global market, accounting for nearly 70% of the total.
Summary of Each Financial Statement
Apple has a current liquidity ratio of 1.06, which generally indicates good short-term financial strength. As of June 2019, Apple had opened 506 retail stores in 25 countries and regions around the world. As of 2019, the company had approximately 137,000 full-time equivalent employees. As of September 2019, Apple stock (AAPL) market value was $237, compared with last year’s market value, which is down 1.25%. As of September 2019, Apple’s revenue was $260.174 million, decreased by 2.04% over 2018; net profit was $55.256 billion, decreased by 7.18% over 2018. As the yield curve rises, the market value of bonds held by investors is shrinking. Apple’s $17 billion in corporate debt has lost $280.6 million in value since it was issued. The management cultural concepts of technology, environmental protection, humanity, intelligence, and innovation in Apple’s corporate culture have a significant impact on the sustainable development of the enterprise.
Moreover, through the independent development and design of software in science and technology, Apple Inc. elevates the company’s culture to the ranks of individual production. Thus, it has its own independent advantages and plays a leading role in the electronic technology industry. In terms of environmental protection, every design and promotion of new products has achieved relevant product design (Li, 2020). Although some series of products are upgraded with more powerful functions than the original ones and the screen size is enlarged, the materials are usually reduced by 50%, and the emissions are also reduced by 35%, so as to achieve low carbon emission reduction in the true sense of production.
Apple will finally increase the production of the company to the unique innovation spirit of the enterprise through the upgrading of products. Hence, it can inspire people’s creative potential, providing constant environmental protection and design. Hopefully, the Apple company will maintain the uniquely creative design concept and high-quality development to support the existing well-adjusted system.
A Graph of Historical Stock Prices
Other Information Pertinent to the Corporation That Could Affect its Future Performance and Stock Price
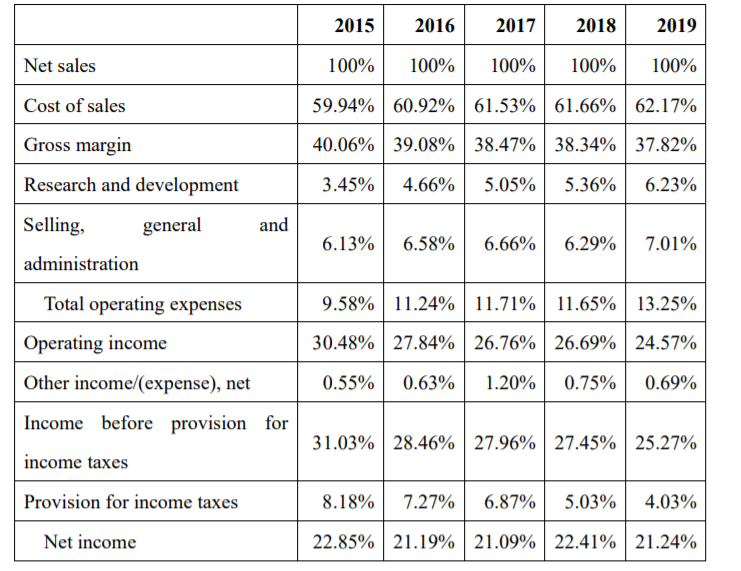
High inventory turnover means high inventory liquidity and high efficiency in converting inventory into cash and accounts receivable. Improving inventory turnover improves a business’s ability to convert inventory into cash and accounts receivable. Lower inventory turnover means a lower ability to convert inventory into cash and accounts receivable. Inventory turnover was 40.13 in 2019, up 7.96 percent from 2018. However, Apple’s sales profit in 2019 is not good because although the cost of sales in 2019 is lower than that in 2018, the inventory is 1.04 times that in 2018 (Li, 2020). From 2016 to 2018, Apple’s inventory turnover rate continued to decline, and the cost of sales continued to increase, which seriously affected Apple’s profit and showed that Apple’s competitiveness in the industry declined. High current asset turnover indicates the company’s ability to maximize sales with minimal current asset investment (Al Mheiri, 2021). The higher the current asset turnover ratio, the better. Current asset turnover declined 11.4% in 2017 from a year earlier, suggesting that Apple’s investment in current assets did not perform well in 2017 (Al Kibaida, 2020). The current asset turnover ratio declined by 13.2% in 2019 compared with the same period in 2018, indicating that Apple’s stock suffered a heavy hit in 2018 and has not recovered in 2019 (Li, 2020). Low-margin companies tend to have higher total asset turnover, while high-margin companies have lower total asset turnover. From 2016 to 2019, the total asset turnover ratio is less than one. It means there’s no turnover of total assets in the five years. The higher the receivables turnover rate, the better because it means that receivables are collected quickly, and bad debts are lost less. Turnover was on the rise from 2016 to 2017 but declined in 2018. The receivables turnover ratio is 2019 is 11.28, down 12.8% from 2018, which means that the receivables loss in 2019 is about 12.8%.
Recommendation Regarding the Future of this Corporation
In 2019, the sales of iPhone, iPad, and Mac are not as high as before, but the service business and sales of Apple’s accessories and home appliances are quickly rising, which is the focus of Apple’s development. Innovation is very important to Apple, which is not only reflected in the annual increase of Apple’s R&D expenditure but also reflected in the declining popularity of Apple products in recent years. Apple needs new products to stimulate consumer demand: China and Europe are both big markets, and Apple could use more preferential policies in this area. In conclusion, the corporation has the good short-term financial strength and has been the leader in the industry for more than a decade. The liquidity ratio and other aforementioned statistics show some decrease in the financial situation in the last couple of years. However, the experts are still quite confident about Apple’s position in the global arena, which lets us argue that the company is worth its investments and worldwide support.
References
Al Kibaida, O., & Nobanee, H. (2020). Financial Statement Analyses of Apple. Available at SSRN 3647455.
Al Mheiri, R., Al Hosani, N., & Saif, E. (2021). Ratio Analysis of Apple. Available at SSRN 3895231.
Chen, C. M., & Ann, B. Y. (2016). Efficiencies vs. importance-performance analysis for the leading smartphone brands of Apple, Samsung and HTC. Total Quality Management & Business Excellence, 27(3-4), 227-249.
Li, B. (2020). Evaluation of Financial Risk in Apple Company. [Annex Income Statement]
Wild, J. (2019). Financial Accounting: Information for Decisions, 9e.
