Introduction
Exxon Mobil Corporation is an American company, the largest private oil company in the world, one of the largest corporations in the world in terms of market capitalization. In 2007, it took the 2nd place in the list of the largest public American Companies Fortune 1000 and the list of the world’s largest corporations Fortune Global 500 (Penkovskii et al. 3158). The current company was created in 1999 as a result of the merger of the largest American oil companies Exxon and Mobil, which is one of the largest mergers of the 1990s. The main owners of the company are investment funds, institutional and private investors, and 99.85% of the shares are in free float (Penkovskii et al. 3159).
The company’s shares are taken into account when calculating the Dow Jones index. The company produces oil in various regions of the world, including the USA, Canada, and the Middle East, among others. Exxon Mobil has a stake in 45 refineries in 25 countries and has a network of filling stations in more than 100 countries (Penkovskii et al. 3161). The economic situation of the corporation has been affected by the pandemic causes changes in demand, supply, and eventually profits.
Exxon Mobil Corporation represents the oligopoly market model from the characteristics it displays. This organization operates in a market where less competition and more strategic performances are causing it to belong in this market model. In the market of Exxon Mobil, dominant firms are not many as compared to the small ones (Meyer 246). The company uses differentiation as its strategy by concentrating on the innovation of quality and commodities for them to realize profits in the market. The firm employs nonprice competition extensively in its operation to avoid price wars with its rivals. This firm is a major corporation and this causes it to control the market. The market in which this firm operates has few companies having large market shares.
Industry Situation
Exxon corporation belongs to the oil and gas industry in the United States. The situation in the oil and gas industry is such that it has fluctuating economic cycles and is accustomed to highs and lows. The pandemic has caused a downturn in the industry as it posed a risk to the survival of many firms. This is coupled with a longstanding decline in the demand for petroleum products and this results in a projection of having a different look in the oil and gas market in days to come. The market is now recovered but there is uncertainty on how the market will look in times to come as a result of rising COVID-19 cases that may lead to shutdowns and restrictions. In April 2020, the demand for oil around the globe had fallen by 25% but it has now recovered and this has helped in reducing losses (Ambrose).
In 2021, the oil demand has recovered greatly even though it is still lower than when it was before the pandemic. There has also been a failure in energy stocks and prices for oil and gas in recent times (Ambrose). The reputation of the industry has been ruined due to its massive layoffs brought about by the pandemic since it was a reliable employer. The industry now focuses on various strategies to ensure it survives the effects brought by the pandemic. There is now an attitude and an obligation for new management on clean energy. There are changes in the demand patterns and new talent strategies are adopted for future success.
Supply and Demand and the Price System Graphs
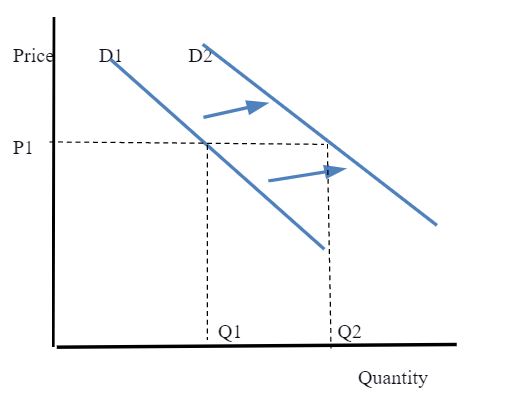
The current demand situation in Exxon Mobil corporation is that it is increasing compared to last year. People have come up with strategies of how to deal with the impacts caused by the pandemic and this has helped in increasing demand for oil and gas products. The demand curve is now shifting to the right side, unlike last year where it was shifting to the left. In 2020, the company experienced losses and this made the curve shift to the left (Ambrose).
Currently, the earnings of the company have improved due to an increase in demand for products and this has resulted in the right shift (Vienneau 18). The causes for the shift of the demand curve are a result of the increase in the income of oil and gas product buyers. The number of consumers using products offered by the company has also increased especially when they reported back to their jobs when restrictions brought by the pandemic were lifted (Krauss). The demand curve is now shifting to the right side, unlike last year where it was shifting to the left (see figure 1).
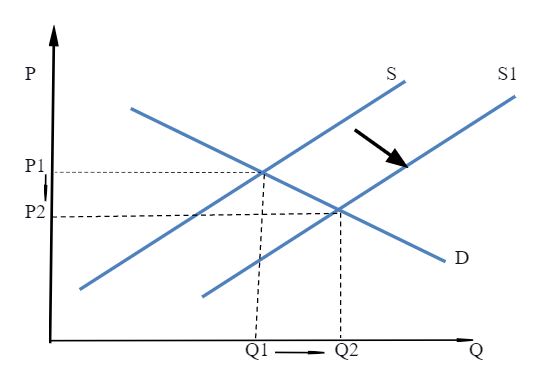
The current situation in the supply curve of Exxon Mobil is that there have been fluctuations. The curve is changing and at the moment it has shifted to the right. In 2020 because of the outbreak of the pandemic, the supply in the oil and gas industry was greatly affected (Ambrose). The drilling stations experienced many problems like having insufficient laborers and this contributed to the decrease in the supply of oil products. There are currently favorable natural conditions and a decrease in the input prices that allow for the production of oil and gas products. Also, the regulations for oil and gas products in the United States are now less compared to the year 2020 when the pandemic set in. The supply curve of the corporation is now shifting to the right side (see figure 2 below)
The Market Equilibrium in Exxon
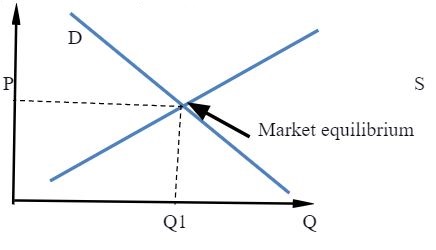
Market equilibrium refers to when the demand for commodities provided by Exxon is equal to the supply of the same. Currently, demand for the products provided by the organization is equal to its supply. The quantity of demand for oil and gas is equal to the supply of oil and gas in Exxon (Krauss). Price ceiling refers to the higher price set by the government in the United States such that the price of oil and gas cannot be above it. Exxon is currently at the equilibrium point in the market since it is supplied with enough products that match the demand for the same. Supply and demand curve for the corporation now meet at the equilibrium point (see figure 3).
Changes in Income and Results
There is a change in the real income of oil and gas consumers that has led to a change in purchasing power which finally resulted in a change in demand for products and services produced by the company. When the pandemic set in, the real income of consumers reduced since there were changes in nominal income and this resulted in a decrease in the quantity demanded. Exxon corporation provides normal goods to its consumers since its demand increases when the income of individuals and their purchasing power increases. Also, a slight decrease in its prices can result in to increase in the quantity demanded.
Changes in Prices of Related Goods & Results
Change in prices of goods that are related to oil and gas supplied by Exxon affects the quantity demanded. In the case of substitute products, when their prices are decreased, the quantity of demand for products provided by Exxon decreases (Penkovskii et al. 3160). Renewable natural gas is a substitute product for Exxon’s product and is offered by its competitor. When the rival decreases its price, the quantity of oil and gas demanded by consumers from exon decreases. The company’s demand pattern is currently affected though slightly since the substitute products are offered at a relatively low price.
Short-Run Costs
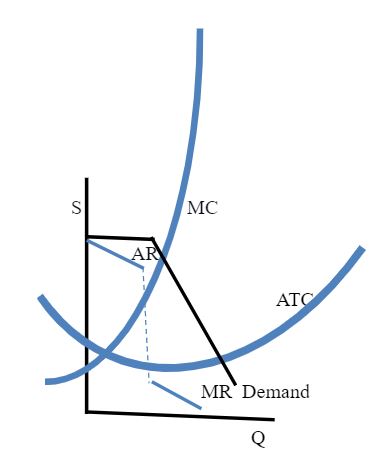
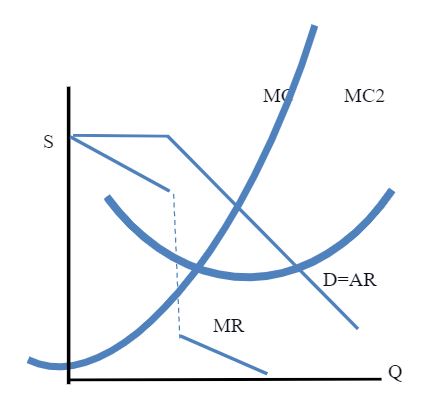
Exxon Mobil Corporation is currently making normal profits even though they have reduced compared to previous years before the pandemic (Krauss). The firm has been charging prices that are higher than the average cost used in producing oil and gas; this has enabled it to earn profits even in the middle of the pandemic when other companies are crushing (Meyer 225). The corporation is above the is on the target since it has realized normal profits in the current financial year. The short-run costs are now resulting in normal profits in the organization (see figure 4)
Long-Run Costs
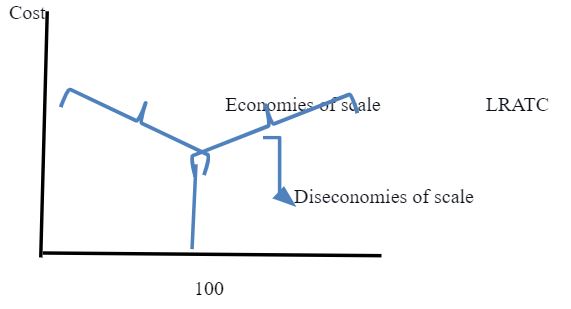
The cost problems in Exxon corporation arise from the cost of production that causes an effect on the economies of scale for the company. The average cost of producing oil and gas is not falling as its output rises. Large-scale production of oil and gas by Exxon should lead to low average costs (Aguirre 52). This long-run curve however allows changing the factors of production. This means that when this firm decides to double its cost of production, it can process as much oil and gas as possible like four times much. This shows the economies and diseconomies of scale for the company (see figure 5).
Planning Curve
The planning curve shows the average cost of Exxon corporation in the long run. This curve is used in making plans since the organization will seek to maximize its profits in the long run. This is done by equating the long-run marginal revenue and cost (Meyer 181).
Conclusion
The oil and gas industry in the united states has been affected by the pandemic. There has been a change in the supply and demand curves of organizations in the country; the cost curves were also greatly impacted by the pandemic. This economic problem may be corrected by the company coming up with strategies for operating and maximizing in worst-case scenarios like the pandemic. The prediction for the future of the economic condition is that there will be many changes in demand and supplies of organizations since the worst scenarios are yet to happen. The future economy may face many problems since many pandemics are like COVID-19 are projected to happen and this means that companies need to stay prepared.
References
Aguirre, Iñaki. “Cournot Oligopoly, Price Discrimination and Total Output.” (2017).
Ambrose, Jillian. “ExxonMobil warns of $30bn writedown of shale assets amid energy price slump”. The Guardian, 2020. Web.
Krauss, Clifford. “Exxon Mobil and Chevron report first quarterly profits after several losses”. 2021. Web.
Meyer, Debbie. Concepts in Economics. 12th ed., United States, McGraw-Hill, 2015.
Penkovskii, Andrey V., et al. “Search for a market equilibrium in the oligopoly heat market.” Energy Procedia vol. 105 (2017): 3158-3163.
Vienneau, Robert L. “A Reswitching Example in a Model of Oligopoly.” n.d. Web.

