Abstract
One of the foremost trepidations of the multi-rotor systems’users is torsional vibrations. As opposed to the lateral dynamic issues of a rotor, torsional failures are very atrocious as the first problem symptom is mostly a shaft that is broken, coupling or even a gear tooth. To make matters worse, there is a significant difficulty associated with detecting such incipient issues in the field. As such, the performance of such torsional systems is thoroughly assessed so as to ensure that there are few chances that such incipient failures are detected in good time. It is worth noting that one of the chief causes of torsional vibrations issues is synchronous motors. The rationale behind this assertion is the huge torques generated during starting that is usually in a pulsating form. In other words, the endurance limits of the material employed in constructing rotor shafts is, in most cases, exceeded by the torsional shaft stresses that the pulsating-type torques trigger. As a result, the lifespan of multi-rotor systems is made to be limited. The chief goal of this report’s experiment was to perform a comprehensive assessment of how a 3-rotor system which is installed in T5.01 of John Dalton Building behaves while under vibration. That is, most, if not all, aspects of the vibration analysis will be thoroughly investigated based on the existing theories of vibration, experimental testing as well as computer simulations. As for the latter analysis, the key software that will be utilized is MATLAB.
Objectives
The main objectives of this experiment are:
- To conduct a vibration testing to acquire input/output data necessary for analysis via various theories and experiments.
- To estimate the Frequency Response Function (FRF) and the modal parameters from the measured data
- To establish an idealized torsional vibration model of the 3-rotor system
- To set up a mathematical model for the idealized torsional vibration system
- To carry out modal analysis and sinusoidal response calculations by manual solution
- To carry out modal analysis and sinusoidal response simulations using MATLAB
- To simulate the vibration response to the measured input and correlate the result with the measured response
- To carry out a sensitivity study and investigate the causes of discrepancies between the analytical results and the measured results
- To gain further knowledge about how vibrations are investigated in industrial applications
Introduction
Background
Most of industrial machinery is by nature rotary. As such, torsional vibration is quite inevitable in these scenarios. This kind of vibrations has a tendency of causing damages of the components attached on such machines. As earlier alluded to, detection of torsional vibrations is hard due to the generated torques that is pulsating in nature (Hill 2013). Therefore, such vibrations can be utterly hazardous to operators. Based on the perspective of the industrial operations, determination of such rotating systems’ natural frequencies is pretty vital as it plays a substantial role in ensuring that there is a safe operation of the equipment (Rao 2007).
Moreover, at speeds close to the natural frequencies, there occurs a comparatively excessive strain. As a consequence, there are greater chances that most of the components of the rotary machinery will be damaged or fail to function. Even if one of the two mentioned results does not occur, untimely premature failures brought about by fatigue of the components is likely to occur (Myklestad 2013).
The Fundamentals of Vibrations
Basically, vibrations is all about the systems’ dynamic behaviour with respect to a given state or position commonly referred to as the equilibrium position. In order to carry out a comprehensive analysis of vibrational systems, all physical features (otherwise known as parameters) of such systems are analyzed one after the other. While executing the analysis via such software as MATLAB, the discrete parameters usually replace the continuous ones in a process commonly referred to as lumping. This is a common algorithm in experiments involving continuous systems. In so doing, given mathematical models can be deployed in verifying the computed results. The mathematical models that are utilized in carrying out vibrational analysis are broadly categorized into two- continuous (otherwise known as the distributed parameter) systems and the lumped (otherwise known as the discrete parameter) systems (Singh, 2011).On the other hand, systems that oscillate are broadly classified as nonlinear or linear. As for the former oscillatory systems, the famous superposition principle does hold in addition to there being a well-developed mathematical modus operandi that can be used to analyze them. As for the latter, the reverse holds. It is worth noting that there is a tendency of most, if not all, systems to become nonlinear whenever oscillations’ amplitudes tend to increase. Furthermore, there are two general groups of vibrations- free vibrations that is due to the system’s inherent forces and forced vibrations that is due to applied external forces (NPTEL 2014)
Besides, some forms of resistances like friction may subject vibratory systems to some form of damping. This is usually as a result of heat energy dissipation which is associated with resistance to motion. However, computation of the natural frequency is carried out on the assumption that there is no damping. This is due to the fact that since damping has an insignificant impact on it. Inasmuch as damping may actually be viewed as a negative occurrence, it plays a very fundamental role when a system is at resonance. At this particular point, damping tends to effectively limit the amplitude of oscillations (Rao & Gupta 2006).
Torsional Vibration
This type of vibration works in such a manner as to bring about some sort of relative twisting in the members of the vibration system that are rotating. The motion, which is oscillatory-twisting in nature, appends itself onto that of the shaft of the rotating equipment which is steady. Another point worth noting concerning torsional vibration is systems that are made up of multiple driven components that also rotate. In such systems, there is occurrence of what is known as periodic torsional vibration. This implies that each particular component in such a system experiences some kind of torsional vibration. Therefore, there is a necessity in executing a thorough analysis of torsional features of each and every component (Singh 2011).
There are a number of factors that may trigger torsional vibrations in shafts of rotating machines. These are: the forces of inertia that usually result from mechanism that reciprocate the rotating parts like pistons, loads with compulsive features that occur in the course of a normal cycle of the machine like when a punch press is being operated, torques that are associated with certain frequencies such as that of a turbine blade passing as well as tooth meshing, and loads causing shocks when applied to electrically operated machines like a fault on a generator line accompanied by removal of such a fault and thus a closure.
The systems in which the range of the source frequency and the torsional vibrations’ natural frequency curing normal operation is relatively small (systems with flexible shafts and massive rotors), there exists a prospective design problematic region that is constituted by torsional vibrations (Budynas & Nisbett 2014).
Laboratory work
Apparatus
The following is the list of apparatus and instruments that were necessary for the execution of the vibration test of a torsional system experiment:
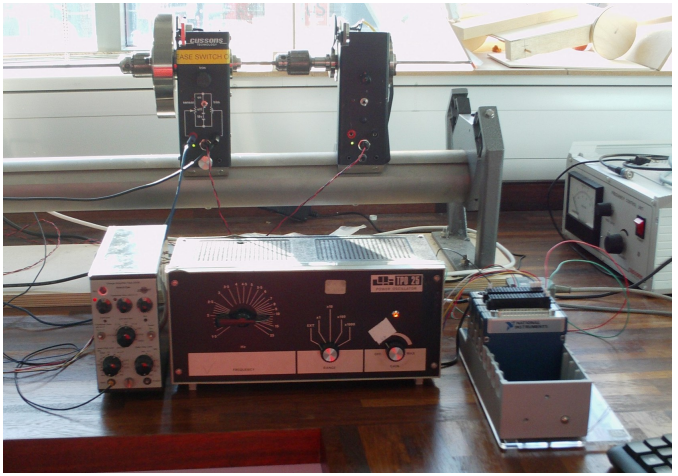
- NI cDAQ-9178 (as depicted in fig. 2 below)
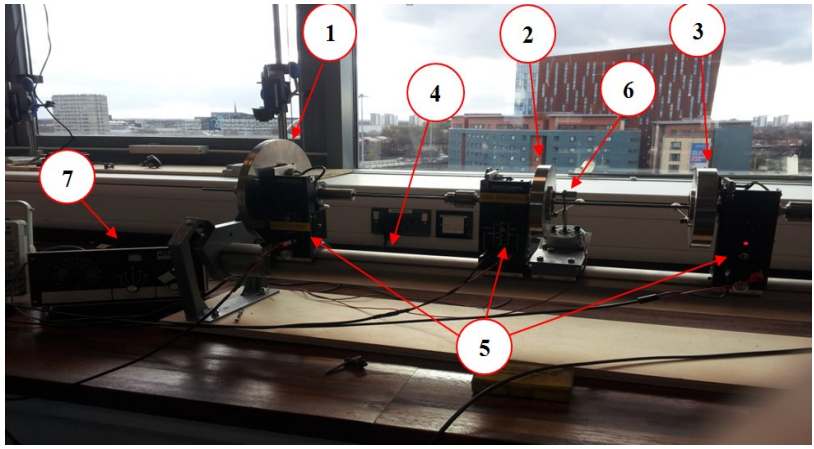
- Electromagnetic shaker 6 and an amplifier (TPO 25) 7 (as depicted in fig. 1 below)
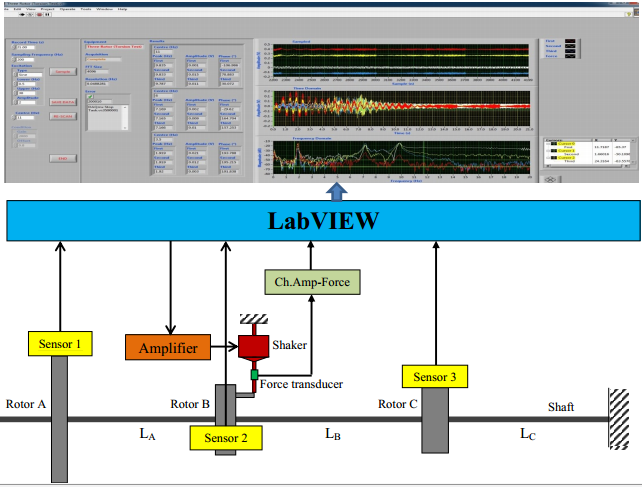
- Computer with Lab VIEW program [Three Rotor (Torsion Test)]
- Three angle transducer units 5 whose Calibration factor = 2.753 V/rad (as clearly shown in fig. 1 below)
- 1 force transducer with a charge amplifier for the shaker force (as clearly depicted in fig. 2 below)
- Torsional rig setup with three inertia discs 1, 2 &3, coupled by a shaft 4 (as clearly indicated in fig. 1 below)
Useful figures for the experiment
Procedure and Results
To carry out vibration testing to acquire input/output data
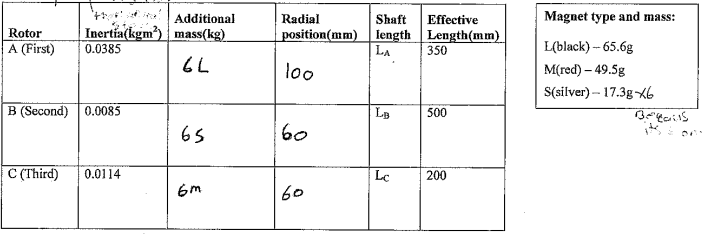
The test was executed in the allocated sessions as per the Dynamics lab groups.pdf. A unique set of physical parameters (that is, shaft stiffness as well as mass of the rotor) were utilized under this part (Rao & Gupta 2006).
Results
When the above procedure was keenly followed to the end, the results in table 1 below were recorded.
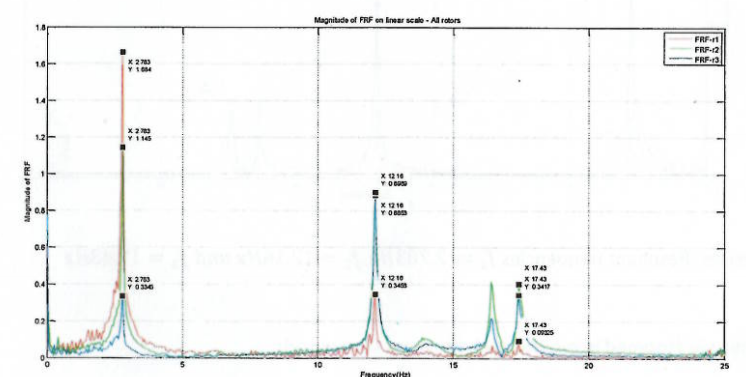
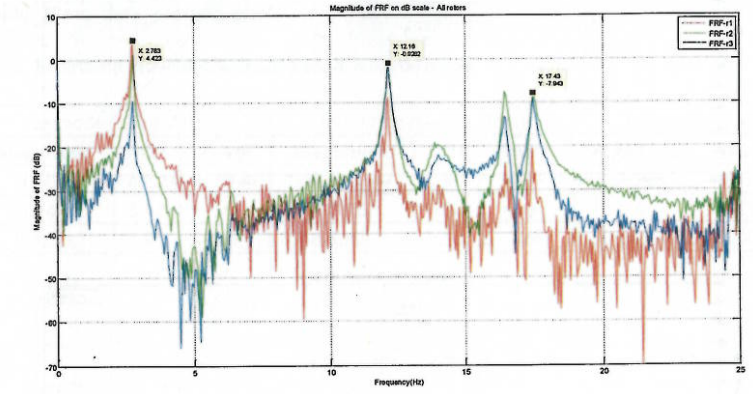
To estimate the Frequency Response Function (FRF) and the modal parameters
From the measured time histories of the excitation and the angular displacement response of the rotors, the FRF for each rotor was estimated by applying digital signal processing techniques using MATLAB.
Results
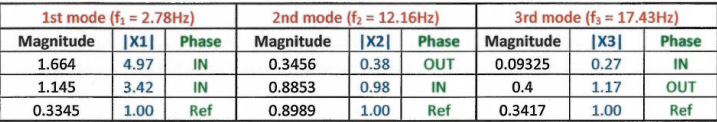
Table 2 below shows the result obtained after keenly executing step (a) above.
The resonant frequencies and the associated normal modes were also estimated.
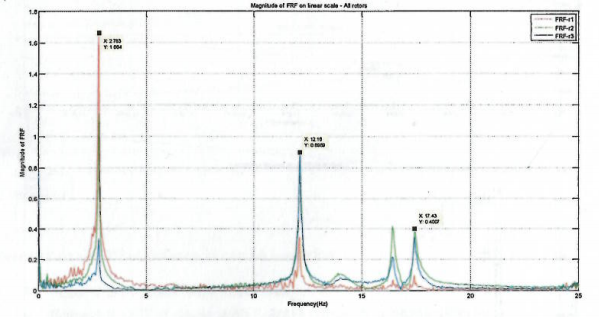
As per the snipped figure 4 below from MATLAB’s output, the resonance frequencies at each normal mode were estimated as follows:

The modal damping ratio (initial stage) for each mode was then estimated.
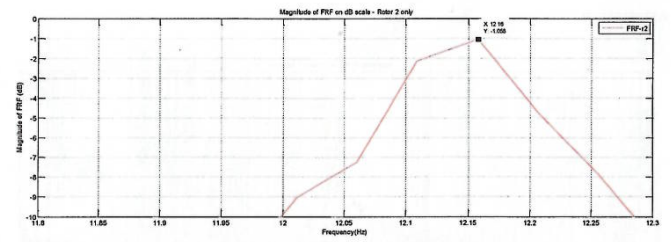
Based on figure 5 below, the modal damping ratio can be estimated via the aid of equation (1) below.
In order to estimate the modal damping ratio, the following formula is used;

 down from the peak value, ωp represents the peak frequency of that particular mode. Based on equation (1) and figure 5, the damping ratio is estimated to be:
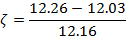

=0.01891
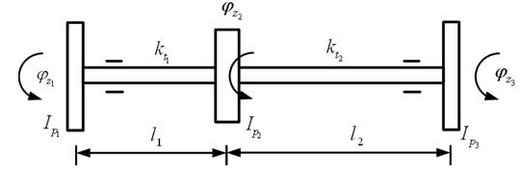
To establish an idealized torsional vibration model of the 3-rotor system
An idealized torsional vibration system model was established by examining the 3-rotortest rig setup and the information provided about the system, and making appropriate assumptions.
Results
The procedure above yielded the model in figure 6 below;
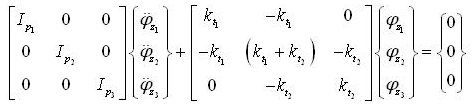
To set up a mathematical model for the idealized torsional vibration system
The equations of motion of the torsional vibration system shown in fig. 3 above were then set up as in equation 2 below:
To carry out modal analysis and sinusoidal response calculations by manual solution
The natural frequencies and the normal modes were determined via the matrix iteration method.
Results
As per fig. 7, the displacement response pattern of the system is close to the associated normal mode at each and every resonance frequency. Thus, the relative peak values can be utilized in estimating the magnitude of the normal modes (X1, X2 and X3). Table 1 has more values that were extracted.
The vibration response to a sinusoidal excitation at each of the natural frequencies was determined by using the Modal Superposition method.
To carry out modal analysis and sinusoidal response simulations using MATLAB
The natural frequencies and the normal modes were determined using MATLAB and the results were as in table 1 above.
The vibration response to a sinusoidal excitation at each of the natural frequencies was simulated by using the Modal Superposition method. The result is as in figure 8 below:
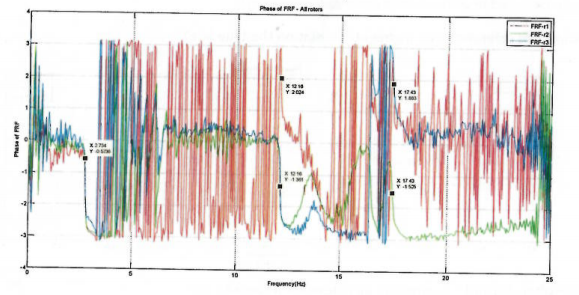
As per figure 8, the displacement response pattern of the system is close to the associated normal mode at each and every resonance frequency. Thus, the relative phase values can be utilized in determining the normal mode phase relations (X1, X2 and X3). Table 1 has more values that were extracted.
The MATLAB simulation results were then verified by the manual solution.
The two values were different due to certain error associated with experiments, especially manual computations. Such errors include:
- rounding off figures,
- approximation of figures for easier operations
- Systematic errors, and
- aging effects of the components
Table 1 above contains values of the natural frequency that were obtained after altering modal damping ratio values.
To simulate the vibration response to the measured input and correlate the result with the measured response
The natural frequency’s values at the three different levels were different. The difference is brought about by some of the sources of errors outlined in part 6 above.
Figure 9 below indicates the simulated results:
The FRF was then estimated using the excitation and the simulated response time histories in 7 (a) and results were as table 1 represents.
There was an observed discrepancy between FRF in 2 (a) with the simulated one in 7 (c), as depicted in table 1 due to the systematic errors as well as loading and aging effects of the components
In brief, the key causes of discrepancies between the analytical values and the measured ones are:
- The aging and/or loading effects- after sometime, the components of the system wear off and thus cannot maintain their original rigidity and stiffness,
- Calculation and approximation of expressions: this occurs due rounding off of figures and approximation of decimal places. In so doing, the parameters determined with these values will inherit the errors.
- Construction effects: the instruments used for this experiment have their own tolerance, mostly inherent from the manufacturers. When the readings are taken from such instruments, with these errors unaccounted for, the validity of the values is usually compromised and thus the discrepancy.
- System error: when the entire circuit is connected, some equipment and components used such as connecting wires have such parameters as resistance which is hardly accounted for during the calculations and thus the reading of the components. This, as well, results in deviation between the recorded values and the true value (Budynas & Nisbett 2014).
Finite element method – one where the information concerning natural frequencies for rotary systems can be easily determined. It utilizes the discretization principle.
The Holzer’s method- one in which frequencies and shapes of systems’ torsional vibrations are determined. A type of frequency called trial frequency is set then torques for other wheels are established (Budynas & Nisbett 2014).
Conclusion
Based on the discussed concepts and algorithm:
- A comprehensive torsional vibration assessment must be executed as one of the key steps of the design procedure.
- Torsional vibrations are hard to detect hence extra care must always be applied while operating such machines.
- This kind of analysis followed by fatigue life assessment as well as testing of strain gauge needs crucial skills and thus warranting no underestimation of the expertise of the engineer involved.
- Errors that are usually ignored end up impacting greatly on the real-life industrial applications.
Reference list
Budynas, R & Nisbett , K., 2014. Shigley’s Mechanical Engineering Design (McGraw-Hill Series in Mechanical Engineering), Macmillan, New York.
Hill, F 2013, Engineering Dynamics Incorporated, Macmillan, New York.
Myklestad, NO 2013, Vibration Analysis, Springer, Berlin.
NPTEL 2014, Three-Disc Rotor System, Springer, Berlin.
Rao, JS & Gupta, K 2006, Introductory Course on Theory and Practice of Mechanical Vibrations, New Age International Publishers, New York.
Rao, SS 2007, Mechanical Vibrations, Dover Publications, Nineola, N.Y.
Singh, VP 2011, MechanicalVibrations, Dhanpat Rai and co, Berlin.
