Abstract
The aim of this report is to carry out comprehensive stress analysis of a car chassis. It is worth noting that the aforementioned stress analysis algorithm on such a structure as a car chassis helps to a greater extent overcome the possibilities of their failure while in use. Stress analysis provides critical insight into the structure and thus the manufacturer can infer whether the structure and its material are up to the task or not. In addition, a very vital type of analysis called finite element analysis allows the manufacturer to predict the region that tends to fail due to loading1.
As such, there is a need to analyze the effect of load to be applied to such a chassis, like the body and the driver’s weight. The current task contains the boundary conditions as well as the load cases for the stress analysis of chassis using finite element analysis. As for the cross and longitudinal members of the car chassis, the shell elements are used with the advantage of easily obtaining stress paraphernalia either over the complete bit of the structure or its subsections.
Therefore, based on the loading and the boundary conditions of the car chassis provided, a stepwise stress analysis is hereby carried out to examine its possible behavior when certain loads are applied to it. That is, the behavior of the chassis of the car will be analyzed based on such scenarios as possible fracture points under load and when a section of it is cut to allow construction of a place where the seat of the driver is to be located. Finally, a detailed algorithm of how to run a simulation on the structure will be executed to affirm the resemblance of the values and figures of the structure.
Introduction
Background
Due to continuous, predictable, and steady model changes brought about by advancement in technology, there is an intensified product changeover in the entire history of the automobile industry [1]. As such, there is need to deploy advanced stress analysis techniques so as to ensure there is production of rigid vehicles. The concepts utilized in order to come up with such a structure as a car chassis have to be advanced so as to meet the current consumer needs like safety.
Furthermore, in order to meet some other vital safety and economical requirements, there has been a rapid change and an increased demand for the automobile designers [2]. The latter requirement is mainly achieved through weight reduction of the materials used to make the structures [2]. It is worth noting that other factors that are usually considered to be vital in such industries as one under analysis like experience can barely help. This is due to the fact that there is hardly any performance data on these new criteria and that the concepts needed to have this analysis executed comprehensively are utterly complex.
Fundamentally, a car chassis is a framework that supports the key, if not all, parts of the vehicle like the engine and the general body [3]. The chassis of the car is responsible for the provision of its support and rigidity. As far as its structural aspect is concerned, there are longitudinally extending channels that are cut across by numerous transverse ones. Also, these transverse channels possess a lesser cross-section so as to give some storage space for the longitudinal channels. In all these, the safety of the structure is given top priority in each and every design stages. From a general perspective, the car chassis types are ladder, backbone, monocoque, and space-frame.
From yet another crucial front, the avenue of mathematical modelling is quite crucial and worth exploring. For instance, the recent approach dubbed finite element approach is one of such methods that have established new and relevant insights into this field of vehicle design [2].
Load considerations
For a proper stress analysis, the static load3 cases have to be appropriately taken into consideration even though there is a design requirement based on the adequate durability under conditions that are dynamic in nature [4]. In order to appropriately consider individual load cases, values of such loads are taken from the anticipated conditions of service of the car. It is also worth noting that the distributions of the loads (otherwise referred to as the worst-case conditions of loading) in addition to the overloading are key considerations for this case of static loading. Some of the key dynamic conditions that are worth considering for this stress analysis algorithm include:
Loads on the Grades
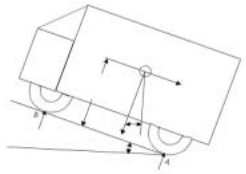
The axle loads are always influenced by the grade. In order to determine the weight on the real axle, equation 1 below is applied.
Mr × L = Mt Cos θ × Lf ñ Mt Sin θ × H
With this equation, any increment in weight on rear axle as a result of the grade can easily be obtained. As well, any kind of shift due to the negative grade is easily determined.
Steady State Cornering
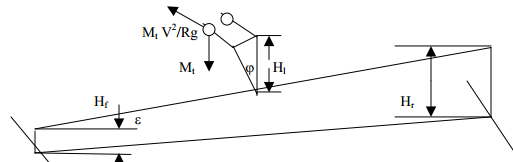
During cornering, there are forces that act laterally on the roll axis4 of the chassis. The existence of a lateral separation between the suspensions gives room for the development of resting moments. These moments are proportionally related to the difference that exists between the roll angle of the axle and the body [3]. Thus, Kϕ = 0.5 × Ks × s2 Kgf mm/rad
Taking moment about the roll axis, considering fig. 2 above, Mϕ = [{(Mt × H1 × v2)/(Rg)} × cosϕ + Mt × H1 × sin ϕ]× cosε (3)
Also, Mϕ = (Kϕf + Kϕr).ϕ
In a similar manner, the car experiences centrifugal forces during cornering. To determine the transfer of loads on front axle as a result of rolling, equation (5) below is employed.
Mϕf = [Kϕf.Mt.H1 (v2/ (Rg)) / (Kϕf +Kϕr – Mt.H1)] + Mf.Hf. (v2/ (Rg)) (5)
Also, Mϕf = ∆Fzf.T
Discussion
Questions
Question one
Estimate the most likely point of failure in the structure and explain your answer:
Weight in kg per m
- = (80*3)/0.3
- = 800kg/m
Weight in kg/m
- = (35*3)/0.35
- =300kg/m
Section C is the most likely failure point because, according to the maximum strain theory5 and given a safety factor of approximately 2.3, the maximum weight to length ratio for the section is 117 while that for section B is 1625. Hence section C exceeds the maximum safety ratio recommended for chassis. The other parts are without added loads hence less susceptible to failure.
Question two
Perform hand calculations on a section of your choice to quantify bending stress and shear stress
According to maximum stress theory,
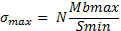
Where:
- σmax– the maximum normal stress;
- N – the dynamic factor load;
- Smin– The minimum section module.
Also given,
Young modulus = stress/strain
E = FL0/A0L
Where:
- E is the young’s modulus
- F is the force exerted on the object
- A0 is the original cross sectional area
- L is the change in length
Cross sectional area = 3.142*0.25*0.25 = 0.196375m2
Now, 70*109 = (40*[10]↑6)/strain
Thus, Strain = 5.714*10-4
At point B,
F = 80*3*9.81 = 2354.4N
From the formula
E = FL0/A0L
70,000,000,000 = (2354.4*0.3)/ = 0.196375*L
L = 5.1385*10-8 m
Question three
Conduct finite element simulation to analyse the structure (remember to describe the steps – not the buttons you push but the process and decisions you have made) [35%].
To run an analysis of the structure of chassis, certain steps were conducted using the Geo metro to help analyse the impact caused on hitting it on a post that is rigid. In the simulation, a car model of about 3755mm in length and about 15600mm in width was used. Its height was estimated to be close to 1400mm. The centre of gravity with respect to the ground was nearly 500mm high [4]. The model car weighed approximately 1400kg.
The model consisted of 193200 vehicle elements that further had about 200345 nodes. The car model had 240 machine parts that included, among other parts, tyres, suspenders and engines, all of which were of four varying types and made from a range of materials.
The parts of the structural body were made from steel (low carbon steel). However, the different parts also had varying properties mechanically. This was important so that each part could represent a different type of steel grade. This was further important in analysing the stress and strain responses under different circumstances. On the other hand, the steel materials had the similarity of plasticity [6] material specified at 24 while the tyres, all of different types, had the same rubber material of about 07.
The same modelling was done on the engine parts such that the brackets and accelerometers were elements of varied stress materials. There was a distinct differentiation of the discrete and beam elements for use on the members that were suspended.
In the exact test, the car model was step to hit a 250mm post at a velocity of 30km/h. Stress, strain and bending parameters were obtained from the simulation experiment and compared with those from the EuroNCAP [7] pole test conducted in 1999. There was a close resemblance of the values obtained and those from the 1999 experiment.
Question four
A section shown in figure 3, the red dotted rectangle, is cut out of the chassis to allow the driver to sit in the vehicle. You need to decide the size and location of the cut. Adapt your FE model to analyse the stress in the structure and describe any corrective action that would be necessary to make the vehicle safe [25%].
In the simulation experiment, the model seats were also tested in the respect of the required stress material, size as well as positioning. In the simulation case, the seats were specifically modelled to have two dimensional shell elements [4]. Like the body model, the seat structure model had 2750 shell elements with four nodes each.
As described in the question statement above, a space was cut to allow the positioning of the seat. In order to determine these aspects, it is of utmost importance to determine the values that will offer the chassis and car model the desired balance and favourable response to pressure and stress.8
The first parameter to consider is the size of the seat. For the seat position, three dimensions; front to back in the chassis, height and angle are taken into account.
For approximate values from the model, the distance from the back to a point 20mm to the side of spine depression should range mostly between 35mm to 15mm. the tilt angle largely depends with the discretion of the seat user but often times, the angle is set to 65 degrees or there about from the horizontal. This is important in lowering the centre of gravity and improving general stability.
According to the recommendations by Ramamurti [4], a height of about 5mm below the level of the main chassis equally boosts stability. The seat can be set to about 1800mm tall and about 200mm in breadth. Having determined these parameters, the seat can hence be placed at point B with the seat space approximated to 2500mm in height, 300mm in width and 2500mm in length [5].
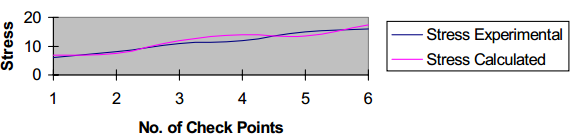
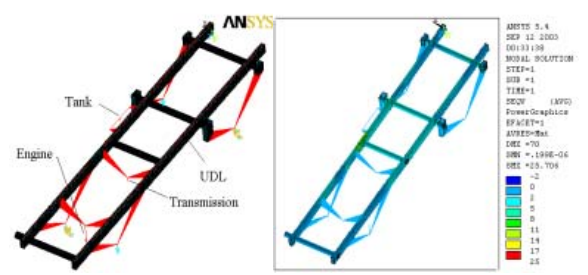
Finite element model of the chassis
With the stress measured at six different locations of the chassis, the result tends to be quite similar. There stresses (the calculated and the measured stresses) were evaluated in ANSYS. Figures 3 and 4 respectively depict this scenario [6]. The chassis of the car is responsible for the provision of its support and rigidity. As for the cross and longitudinal members of the car chassis, the shell elements are used with an advantage of easily obtaining stress paraphernalia either over the complete bit of the structure or its subsections.
Conclusion
In a nutshell, it has been shown in details that a detailed model of a given structure has to be utilized when it comes to any analysis concerning a car chassis. All details as well as aspects of the structure in question must be analysed since this frame plays a very crucial role when it comes to the rigidity and support of the entire car/vehicle [6]. More so, whenever the centre of gravity of the car to be made tends towards the right or left of its central plane, such a comprehensive assessment of stresses must be carried out as per the finite element model. There have been revealed the possibilities of fulfilling the requirements as far as efficiency and sufficient model descriptions are concerned.
In addition, based on the available experimental results of the cases, the finite element model has been tested. Based on the explored theory, availability of sufficient information on load repetitions that creates stresses above the endurance limits of the chassis can facilitate a comprehensive fatigue analysis of the car chassis. Also, vibration responses can be analysed through the use of the same model. Finally, it is worth noting that the stated boundary conditions can be utilized as preliminary stress analysis of the car.
References
- [1] Johanssan & Eslund, Optimization of Vehicle Dynamics in Truck by use of Full Vehicle FE Models, I.Mech.E., 016(93),181-193,1993
- [2] Chandupatla & Belegundu, Introduction to Finite Element in Engineering, PHI, 32(2), 56-79, 2000.
- [3] Reimpell & Stoll, The Automotive Chassis: Engineering Principles, SAE, 6(4), 11, 2000.
- [4] Ramamurti, Computer Aided Mechanical Design & Analysis, Tata McGrawHills, 8(2), 37, 2000.
- [5] Niedermeyer, automotive-history an x ray look at gms xframe, Curb Side Classic, 21(4), 89, 2012.
- [6] Rajput, Main functions of an automobile frame, automobile engineering, 2(3), 410, 2007.
Footnotes
- 1 – SOLIDWORKS Simulation uses the displacement formulation of the finite element method to calculate component displacements, strains, and stresses under internal and external loads. The geometry under analysis is discretized using tetrahedral (3D), triangular (2D), and beam elements, and solved by either a direct sparse or iterative solver. SOLIDWORKS Simulation also offers the 2D simplification assumption for plane stress, plane strain, extruded, or axisymmetric options.
- 2 – This type of dynamic load testing is similar to fatigue testing with emphasis on the actual loading environment and geometry as opposed to idealized loads on coupon samples. The resulting data is based less on assumptions and models with part to part interactions bearing on the outcome of the dynamic load test.
- 3 – A test where data is continuously recorded with data “snapshots” taken at prescribed loading increments. DTB can assist you in any phase of your loads testing program, to determine the actual, real world loading conditions on your system. Using strain gauges, load calibrations, data recording equipment and other instrumentation, the loading history can be recorded and analyzed to satisfy any data requirements you may have. This information can be used in analytical life predictions and for discrete tests. If further testing is required, based on the results, a static load test or a dynamic load test may be recommended. In most cases for solid structures, a static load test is recommended while assemblies with relative motion between parts are better suited for dynamic load tests.
- 4 – Otherwise known as the longitudinal axis, one that runs through the centre of gravity of the car chassis. SOLIDWORKS Simulation can use either an h or p adaptive element type.
- 5 – Yield criteria expressed in terms of quantities like stress state, strain state, strain energy etc. Yield function => f( sij, Y), sij = stress state If f( sij, Y)<0 => No yielding takes place – no failure of the material If f( sij, Y) = 0 – starts yielding – onset of yield If f( sij, Y) > 0 – ?? Yield function developed by combining stress components into a single quantity – effective stress => se
- 6 – If a static load test appears to be the best option, load cases can be developed to simulate critical conditions. During the static load test, data can be continuously recorded with data “snapshots” taken at prescribed loading increments. Dimensional inspections can be conducted to quantify any permanent deflections or set either pre-static loading and/or post-static loading.
- 7 – www.euroncap.com If a dynamic load test is recommended, using statistical methods a loading spectrum can be determined that expands the recorded data into the full range of conditions. If you have simulated or recorded field data, we can work with you to “truncate” the spectrum and weed out the conditions that do not affect the component. The leaner spectrum can expedite testing, thus reducing time and expense.
- 8 – Providing a great advantage to designers and engineers as the adaptive method ensures that the solution has converged.
